I became a homeowner in Park City in 1987 and have been helping clients price homes at Jess Reid Real Estate since 1994. Match this longevity with a penchant for collecting information and you have a Realtor that’s drawn to evaluate trends. My analysis of the single family home market over the last 3 decades reveals 3 distinct cycles with varying characteristics and forces at play.
Let’s Look at the Numbers!
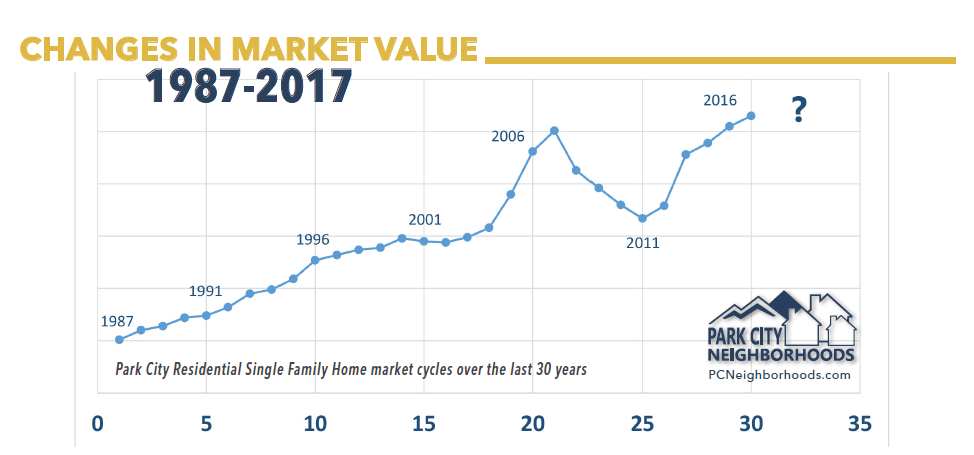
The above graph shows Park City Residential Single Family Home market cycles over the last 30 years. After being in a significant downturn during the 1980’s, the market made a steady climb with appreciation of about 10% per year from 1987 until the end of the 90’s. Things started to change and then the Dotcom crash kept Park City home prices soft for several years. Condo values were affected more than home values, losing as much as 20% over about a 5 year period.
The market started to take off in 2004, fueled by a delayed boost from the 2002 Olympics. There was a real pent up demand and 2005 saw many sales and much appreciation. For the most part the market topped off in 2007 marking the end of the second cycle. We all remember what happened in 2008 with the financial crisis and Park City was affected as much as most parts of the Country.
Recovery started in 2012 and Vail buying Park City Mountain (The Vail Effect”) helped drive us to new highs in five short years. How will the market be doing in a year, 3 years, 5 years from now? One of the things I’m tracking now as a way to keep my finger on the pulse is supply and demand, and changes in inventory level.
Beyond A General Report on Home Sales
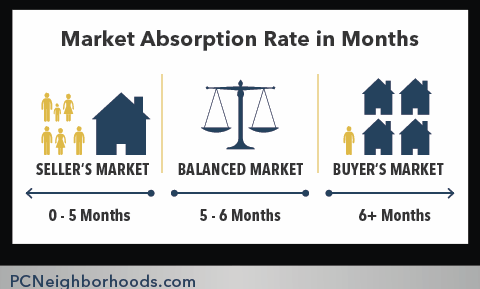
Where are we today? In general terms the market’s doing well but what does that mean? There are many segments of this market, I often say. Park City has single family homes, condos, golf communities, luxury homes, ski-in ski out condos. Obviously they do not appreciate at the same rate. You can even have a buyer’s market and seller’s market within the same neighborhood. Location, property type and price range matter.
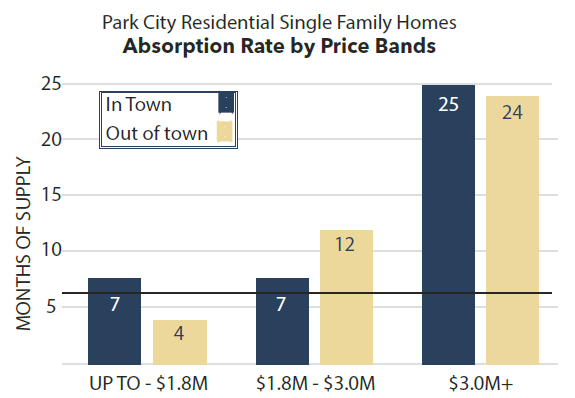
To ascertain the status of a certain segment of the market requires hyper-focus. Residential single family homes account for only about 20% of all sales in Park City. Markets are typically measured geographically. And in Park City, it also makes sense to separate by property type. Within some neighborhoods, such as Old Town, Park Meadows, Thaynes, Trailside, and Sun Peak, homes for sale span a number of price ranges. This second graph is a look at Absorption Rate by area and by Price Bands for the first six months of the year. For homes priced up to $1.8 million it is a Seller’s Market (4.5 month supply). Break that down to either inside city (31 sales) or outside city (165 sales), and the Absorption Rate is 7 months vs 4 months. Moving up to the next price band, $1.8m – $3.0m, we find inside city is a soft Buyer’s market at 7 month’s supply, and outside city is a Buyer’s market with a 12 month supply. And once we get above $3.0 million, the supply is significantly higher with a 24 month absorption rate.
Stay tuned, as I continue to analyze Park City Residential Neighborhoods for signs of stability & change. I’m always available to answer questions, and I’m never too busy for your business or your referrals.
 TOM WARD, REALTOR®, e-Pro, CLA, CRS, GRI, SRS
Certified Residential Specialist
Jess Reid | Christie’s International Real Estate
cell/text 435.647.3727
[email protected]